Testing
Unit tests
KiCad has a limited number of unit tests, which can be used to check that certain functionality works.
Tests are registered using CTest, part of CMake. CTest gathers all the disparate test programs and runs them. Most C++ unit tests are written using the Boost Unit Test framework, but this is not required to add a test to the testing suite.
The test CMake targets generally start with qa_, the names of the tests
within CTest are the same but without the qa_ prefix.
Running tests
You can run all tests after building with make test or ctest. The latter
option allows many CTest options which can be useful, especially in automated
or CI environments.
Running specific tests
To run a specific test executable, you can just run with ctest or run
the executable directly. Running directly is often the simplest way when
working on a specific test and you want access to the test executable’s
arguments. For example:
# run the libcommon tests
cd /path/to/kicad/build
qa/tests/common/qa_common [parameters]
For Boost unit tests, you can see the options for the test with <test> --help.
Common useful patterns:
-
<test> -t "Utf8/*"runs all tests in theUtf8test suite. -
<test> -t "Utf8/UniIterNull"runs only a single test in a specific suite. -
<test> -l alladds more verbose debugging to the output. -
<test> --list_contentlists the test suites and test cases within the test program. You can use these for arguments to-t.
You can rebuild just a specific test with CMake to avoid rebuilding
everything when working on a small area, e.g. make qa_common.
Automated testing
The unit tests can be run on automated Continuous Integration (CI) systems.
By default, tests output human-readable results, which is useful when
developing or debugging, but not so useful for automated test reporting.
Systems that can parse XML test results can enable these by setting the
KICAD_TEST_XML_OUTPUT option to ON. The test results are then output
as files ending in .xml in the qa subdirectory.
Test results are written to the build directory as follows:
-
Boost units tests: one XML file per test with the extension
.boost-results.xml -
Python unit tests: one directory per test with the extension
.xunit-results.xml. These directories contain one.xmlfile per Python test case file.
Writing Boost tests
Boost unit tests are straightforward to write. Individual test cases can be registered with:
BOOST_AUTO_TEST_CASE( SomeTest )
{
    BOOST_CHECK_EQUAL( 1, 1 );
}
There is a range of functions like BOOST_CHECK, which are documented
here.
Using the most specific function is preferred, as that
allows Boost to provide more detailed failures: BOOST_CHECK( foo == bar ) only
reports a mismatch, BOOST_CHECK_EQUAL( foo, bar ) will show the values of
each.
To output debug messages, you can use BOOST_TEST_MESSAGE in the unit tests,
which will be visible only if you set the -l parameter to message or higher.
This colours the text differently to make it stand out from other testing
messages and standard output.
You can also use std::cout, printf, wxLogDebug and so on for debug
messages inside tested functions (i.e. where you don’t have access to the Boost
unit test headers). These will always be printed, so take care
to remove them before committing, or they’ll show up when KiCad runs normally!
Expected failures
Sometimes, it is helpful to check in tests that do not pass. However, it is bad
practise to intentionally check in commits that break builds (which is what
happens if you cause make test to fail).
Boost provides a method of declaring that some specific tests are allowed to fail. This syntax is not consistently available in all supported Boost versions, so you should use the following construct:
#include <unit_test_utils/unit_test_utils.h>

// On platforms with older boosts, the test will be excluded entirely
#ifdef HAVE_EXPECTED_FAILURES

// Declare a test case with 1 "allowed" failure (out of 2, in this case)
BOOST_AUTO_TEST_CASE( SomeTest, *boost::unit_test::expected_failures( 1 ) )
{
    BOOST_CHECK_EQUAL( 1, 1 );

    // This check fails, but does not cause a test suite failure
    BOOST_CHECK_EQUAL( 1, 2 );

    // Further failures *would* be a test suit failure
}

#endif
When run, this produces output somewhat like this:
qa/common/test_mytest.cpp(123): error: in "MyTests/SomeTest": check 1 == 2 has failed [1 != 2
*** No errors detected
And the unit test executable returns 0 (success).
Checking in a failing test is a strictly temporary situation, used to illustrate the triggering of a bug prior to fixing it. This is advantageous, not only from a "project history" perspective, but also to ensure that the test you write to catch the bug in question does, in fact, catch the bug in the first place.
Assertions
It is possible to check for assertions in unit tests. When running the unit
tests, wxASSERT calls are caught and re-thrown as exceptions. You can then use
the CHECK_WX_ASSERT macro to check this is called in Debug builds. In Release
builds, the check is not run, as wxASSERT is disabled in these builds.
You can use this to ensure that code rejects invalid input correctly.
Python modules
The Pcbnew Python modules have some test programs in the qa directory.
You must have the KICAD_SCRIPTING_MODULES option on in CMake to
build the modules and enable this target.
The main test script is qa/test.py and the test units are in
qa/testcases. All the test units can by run using ctest python, which
runs test.py.
You can also run an individual case manually, by making sure the
modules are built, adding them to PYTHONPATH and running the test
from the source tree:
make pcbnew_python_module
export PYTHONPATH=/path/to/kicad/build/pcbnew
cd /path/to/kicad/source/qa
python2 testcase/test_001_pcb_load.py
Diagnosing segfaults
Although the module is Python, it links against a C++ library (the same one used by KiCad Pcbnew), so it can segfault if the library has a defect.
You can run the tests in GDB to trace this:
$ gdb

(gdb) file python2
(gdb) run testcases/test_001_pcb_load.py
If the test segfaults, you will get a familiar backtrace, just like if you were running pcbnew under GDB.
Utility programs
KiCad includes some utility programs that can be used for debugging, profiling, analysing or developing certain parts of the code without having to invoke the full GUI program.
Generally, they are part of the qa_*_tools QA executables, each one containing
the relevant tools for that library. To list the tools in a given program, pass
the -l parameter. Most tools provide help with the -h argument.
To invoke a program:
qa_<lib>_tools <tool name> [-h] [tool arguments]
Below is a brief outline of some available tools. For full information and command-line
parameters, refer to the tools' usage test (-h).
-
common_tools(the common library and core functions): -
coroutine: A simple coroutine example -
io_benchmark: Show relative speeds of reading files using various IO techniques. -
qa_pcbnew_tools(pcbnew-related functions): -
drc: Run and benchmark certain DRC functions on a user-provided.kicad_pcbfiles -
pcb_parser: Parse user-provided.kicad_pcbfiles -
polygon_generator: Dump polygons found on a PCB to the console -
polygon_triangulation: Perform triangulation of zone polygons on PCBs
Fuzz testing
It is possible to run fuzz testing on some parts of KiCad. To do this for a generic function, you need to be able to pass some kind of input from the fuzz testing tool to the function under test.
For example, to use the AFL fuzzing tool, you will need:
-
A test executable that can:
-
Receive input from
stdinto be run byafl-fuzz. -
Optional: process input from a filename to allow
afl-tminto minimise the input files. -
To compile this executable with an AFL compiler, to enable the instrumentation that allows the fuzzer to detect the fuzzing state.
For example, the qa_pcbnew_tools executable (which contains pcb_parser,
a fuzz testing tool for .kicad_pcb file parsing) can be compiled like this:
mkdir build
cd build
cmake -DCMAKE_CXX_COMPILER=/usr/bin/afl-clang-fast++ -DCMAKE_C_COMPILER=/usr/bin/afl-clang-fast ../kicad_src
make qa_pcbnew_tools
You may need to disable core dumps and CPU frequency scaling on your system (AFL will warn you if you should do this). For example, as root:
    # echo core >/proc/sys/kernel/core_pattern
    # echo performance | tee cpu*/cpufreq/scaling_governor
To fuzz, run the executable via afl-fuzz:
afl-fuzz -i fuzzin -o fuzzout -m500 qa/pcbnew_tools/qa_pcbnew_tools pcb_parser
where:
-
-iis a directory of files to use as fuzz input "seeds" -
-ois a directory to write the results (including inputs that provoke crashes or hangs) -
-tis the maximum time that a run is allowed to take before being declared a "hang" -
-mis the memory allowed to use (this often needs to be bumped, as KiCad code tends to use a lot of memory to initialise)
The AFL TUI will then display the fuzzing progress, and you can use the hang- or crash-provoking inputs to debug code as needed.
Run-time debugging
KiCad can be debugged at run-time, either under a full debugger such as GDB, or using simple methods like logging debug to the console.
Printing debug
If you are compiling KiCad yourself, you can simply add debugging statements to relevant places in the code, for example:
wxLogDebug( "Value of variable: %d", my_int );
This produces debug output that can only be seen when compiling in Debug mode.
You can also use std::cout and printf.
Ensure you do not leave this kind of debugging in place when submitting code.
Printing trace
Some parts of the code have "trace" that can be enabled selectively according to a "mask", for example:
wxLogTrace( "TRACEMASK", "My trace, value: %d", my_int );
This will not be printed by default. To show it, set the WXTRACE environment
variable when you run KiCad to include the masks you wish to enable:
$ WXTRACE="TRACEMASK,OTHERMASK" kicad
When printed, the debug will be prefixed with a timestamp and the trace mask:
11:22:33: Trace: (TRACEMASK) My trace, value: 42
If you add a trace mask, define and document the mask as a variable in include/trace_helpers.h.
This will add it to the trace
mask documentation.
Some available masks:
-
Core KiCad functions:
-
KICAD_KEY_EVENTS -
KicadScrollSettings -
KICAD_FIND_ITEM -
KICAD_FIND_REPLACE -
KICAD_NGSPICE -
KICAD_PLUGINLOADER -
GAL_PROFILE -
GAL_CACHED_CONTAINER -
PNS -
CN -
SCROLL_ZOOM- for the scroll-wheel zooming logic in GAL -
Plugin-specific (including "standard" KiCad formats):
-
3D_CACHE -
3D_SG -
3D_RESOLVER -
3D_PLUGIN_MANAGER -
KI_TRACE_CCAMERA -
PLUGIN_IDF -
PLUGIN_VRML -
KICAD_SCH_LEGACY_PLUGIN -
KICAD_GEDA_PLUGIN -
KICAD_PCB_PLUGIN
Advanced configuration
There are some advance configuration options, which are mostly used for development or testing purposes.
To set these options, you can create the file kicad_advanced and set the keys
as desired (the advanced config documentation for a current list. You should
never need to set these keys for normal usage - if you do, that’s a bug.
Any features enabled though the advanced configuration system are considered experimental and therefore unsuitable for production use. These features are explicitly not supported or considered fully tested. Issues are still welcome for defects discovered.
Router debugging
The push and shove (PNS) router has some debugging tools.
PNG debug graphics
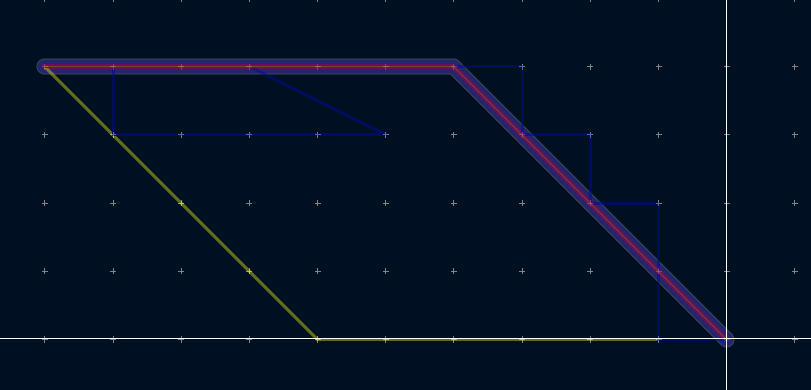
Setting the ShowRouterDebugGraphics advanced config enables graphics which
show some internal state of the router:
PNS logging
There is a logging function that allows the router to store and save a log of events that can be used to replay the events that lead to a problem.
To create a PNS log dump:
-
Set the advanced config option
EnableRouterDump=1and restart KiCad -
During routing, after recreating the issue, press
0. -
Save the
pns.logfile where you want
To view a PNS log, you need to build an extra tool:
-
Set the
KICAD_BUILD_PNS_DEBUG_TOOLCMake setting toON -
Build the
pns_debug_tooltool -
Run this tool with
./qa/tools/pns/pns_debug_tool replay path/to/pns.log